
Wall Street Trade Example
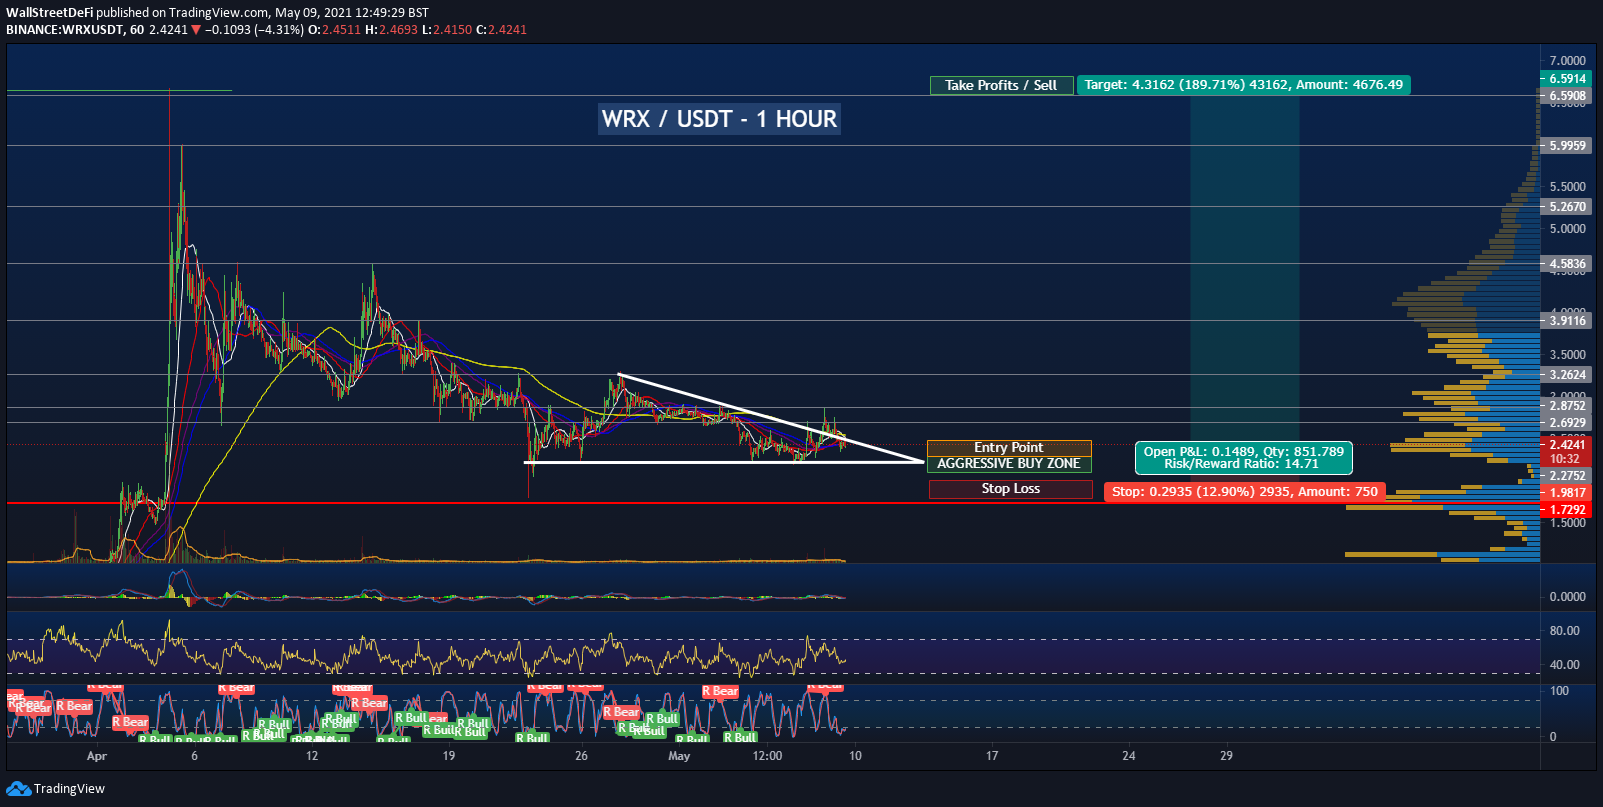 On the chart above you will see grey lines these represent the areas we advise to take some profits. Why do we have various point to exit you may ask? Well lets just imagine that we had one goal of $6.59 for WRX and it reaches all the way to $6.00 and then crashes back down to the stop loss, you made a loss on the trade.
Now on the other hand if the same scenario plays out using the take profit areas on the chart, you will have laddered in profits at each grey line to the tune of x% of the investment.
Meaning you will have still made profits even if it crashes out.
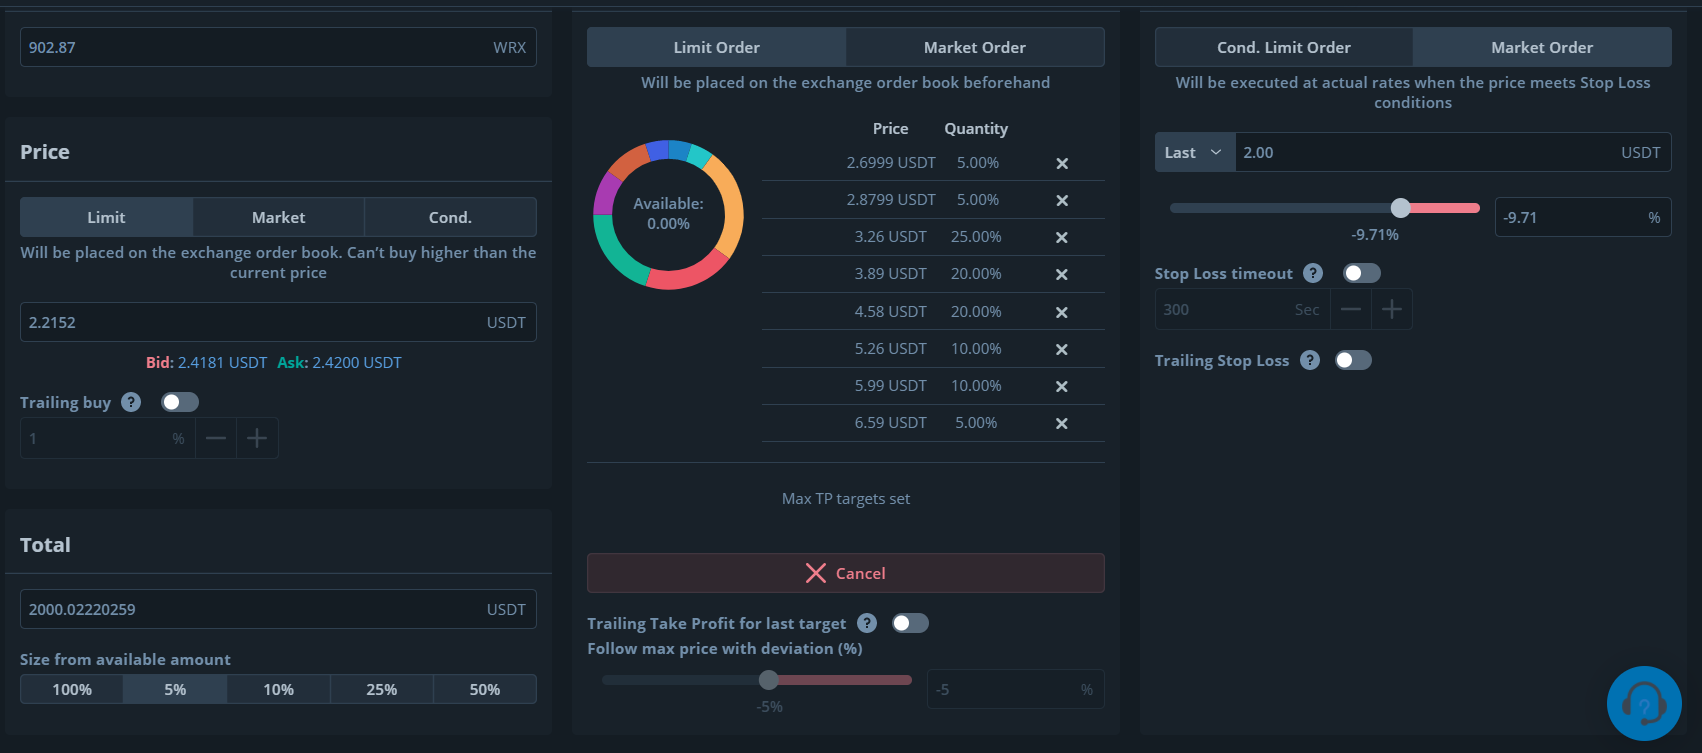 Now on the above you will see we have put our entry point at $.2.2152 in the aggressive buy zone and have added 8 take profit areas from 5-20% that correlate to the call we posted on WRX you will see the grey lines on the chart, you do not have to be exact in the numbers but keep them very close to the grey areas slightly under them is always a good idea. You will notice we have also added a stop loss that matches the chart at $2.0 meaning the call will end and crash out if the market suddenly decided to tank.

The above image shows that you have done everything correctly and can click conform and walk away and leave the trade to play out if need be, setup some alarms also in case.

The image above shows how the trade will look once confirmed and will buy WRX at $2.21.
We recommend you use 3Commas to trade our calls it simplifies the way you trade and you can always see exactly whether you are in profit or loss on a trade at a glance.
Get 3commas here
You can join our premium by clicking the link here